Source: http://www.investopedia.com/terms/h/head-shoulders.asp
Head And Shoulders Pattern
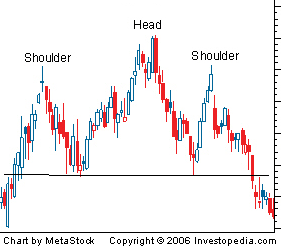
| A technical analysis term used to describe a chart formation in which a stock's price: 1. Rises to a peak and subsequently declines. 2. Then, the price rises above the former peak and again declines. 3. And finally, rises again, but not to the second peak, and declines once more. The first and third peaks are shoulders, and the second peak forms the head.  |
No comments:
Post a Comment